

A Return to Time Use
A Return to Time Use
Changing Rhythms of American Family Life, Chapter 1

The genesis of this substack was my enjoyment of IPUMS and my increasing skepticism of an oft-repeated claim that employed mothers “today” spend as much time with their children as non-employed mothers in the 1970s. I heard this claim frequently enough that I traced it back to the source (Changing Rhythms of American Family Life) and bought a copy. Spoiler alert: they don’t.
But now I have this book! And a substack! So let’s dive in. I’ll go roughly chapter by chapter, laying out fun graphs and extra analyses that struck my fancy in that particular chapter.
The book as a whole mainly focuses on pre-2003 time use studies, and was published in 2006. Since 2003, the Bureau of Labor Statistics has conducted the American Time Use Survey with a subset of Current Population Survey respondents. Prior to this, there were large time use studies in 1930, 1965-1966, 1975, 1985, 1992-1994, 1994-1995, and 1998-2001. The original authors primarily draw on the 1965 study, the 1975 study, the 1985 study, and the 1998-2001 studies.1
I’ve pulled the time series data from the American Heritage Time Use Study Extract Builder to mirror the author’s original selections as well as adding 2018, the most recent ATUS year available in AHTUS. I’ve also pulled data from the 1965, 1975, 1985, 1995, 2000, and 2023 Current Population Survey - Annual Social and Economic Supplement (CPS-ASEC) to see how AHTUS’s sample compared to the larger CPS-ASEC respondents.
The 1965 CPS-ASEC did not ask about the presence of children or those children’s ages in the household, but the 1965 time use study did. We can see how the samples used in the AHTUS datasets stack up against the CPS-ASEC data for mothers and for all women 18-64 in the relevant years.
The graph below shows how usual employment hours varied between the five samples. The 1965 survey had 655 relevant respondents (mothers with children under 18), while 1975 had 1251, 1985 had 754, 1995 had 311, and 2000 had 1036. I provide all five waves because they are discussed in the book, but many of the more in-depth statistics compare 1975 to 2000 (which is actually labeled 1998 in AHTUS and took place from 1998-2001).
If you keep an eye on family policy, you’ve probably heard that most mothers are employed. This is true, and has been true for awhile. However, what employment looks like varies with several factors, such as maternal education and age of youngest child, much like it does with labor market churn. Between 1965 and 2000, labor force participation rose for mothers of all education groups, but remained heterogeneous within the survey waves. However, even in 1965 a majority of mothers with college degrees were in the labor force. By 1975, a majority of mothers who had graduated high school were labor force participants. Increased labor force participation in later survey waves was likely the result of an overall shift towards labor force participation as well as more mothers reaching an educational level associated with remaining in the labor force.
Notably, a chi-square test for labor force participation status between the 1975 and 2000 AHTUS survey wave for mothers who did not graduate high school did not show a significant increase or decrease in labor force participation, though the same test on the same groups using the corresponding CPS-ASEC years did show a significant increase with a much larger sample size. Labor force participation by mothers with high school diplomas went up 50%, while it went up 19% for mothers with college degrees.
Labor force participation also varied by age of youngest child. You may notice that it dips in the 1985 survey for two groups. This dip does not appear in the much-larger CPS-ASEC survey for that year, suggesting that the 1985 study group may not have been representative.
Paid work hours, according to time diaries, also rose from 1975 to 2018 for all mothers and employed mothers.
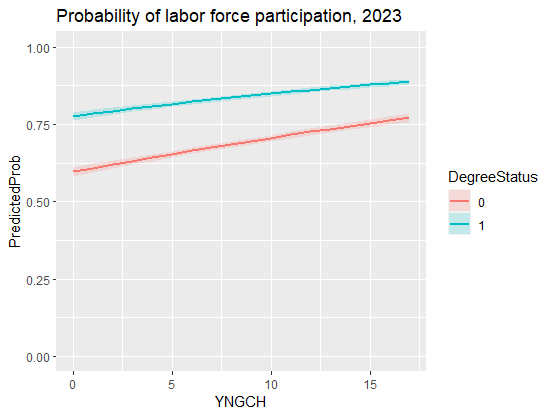
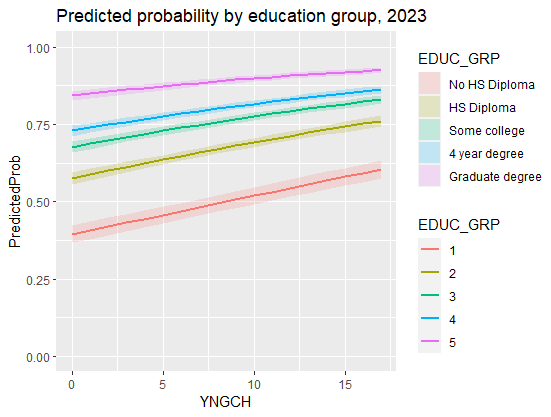
For some additional fun, I used a logistic regression to calculate the probability of being in the labor force based on degree status and age of youngest child in 1975, 2000, and 2023.2 In 1975, a mother of an infant (age 0) without a college degree had a probability of 35.5% of being in the labor force, versus 59.7% in 2000 and 2023. In 1975, the chances didn’t get above 50% until her youngest child was 10. For mothers with a degree, they had a 46.4% chance of being in the labor force with an infant in 1975 and reached higher than 50% when their youngest was 3, and had a 70% chance when their child was an infant in 2000 and 77.7% in 2023.
Full-time work was somewhat less common. In 2023, mothers without college degrees had less than a 50% probability of working full time until their youngest child reached age 6 — two years later than it was in 2000 — whereas the same mothers in 1975 never had a greater than 50% chance of working, regardless of children’s ages. 2023 mothers with degrees had a 62% chance of working full time even when they had an infant, compared to 51.5% for mothers in 2000 and 36.2% in 1975.
Finally, I was curious about the labor force participation probabilities of mothers with graduate degrees. In 1975, mothers whose youngest child was an infant had a 55.8% chance of working, reaching 79.7% for mothers whose youngest child was 17. In 2000, those same numbers were 77.2% and 92.2%, and in 2023, 84.3% and 92.7%.
In sum, the population composition of mothers changed between 1975, 2000, and 2023, as did employment-related probabilities.
I’m sure you’re all riveted. I’ll try to throw in something interesting (how much do boats cost their owners?) in between chapters.
1965: Multinational Comparative Time-Budget Research Project
1975: American's Use of Time: Time Use in Economic and Social Accounts
1985: American's Use of Time Project
1998-2001: Family Interaction, Social Capital, and Trends in Time Use Study and National Survey of Parents