

Who Stays, Who Goes
Who Stays, Who Goes
Labor Market Churn in the Longitudinal Current Population Study and Panel Study of Income Dynamics

Every year, people churn in and out of the labor force. For example, some seniors retire upon reaching 65 or 67. Others may come out of retirement. The diagram below shows the labor force moves of respondents between 60 and 70 who were asked their labor force status in 2022 and then again in 2023.
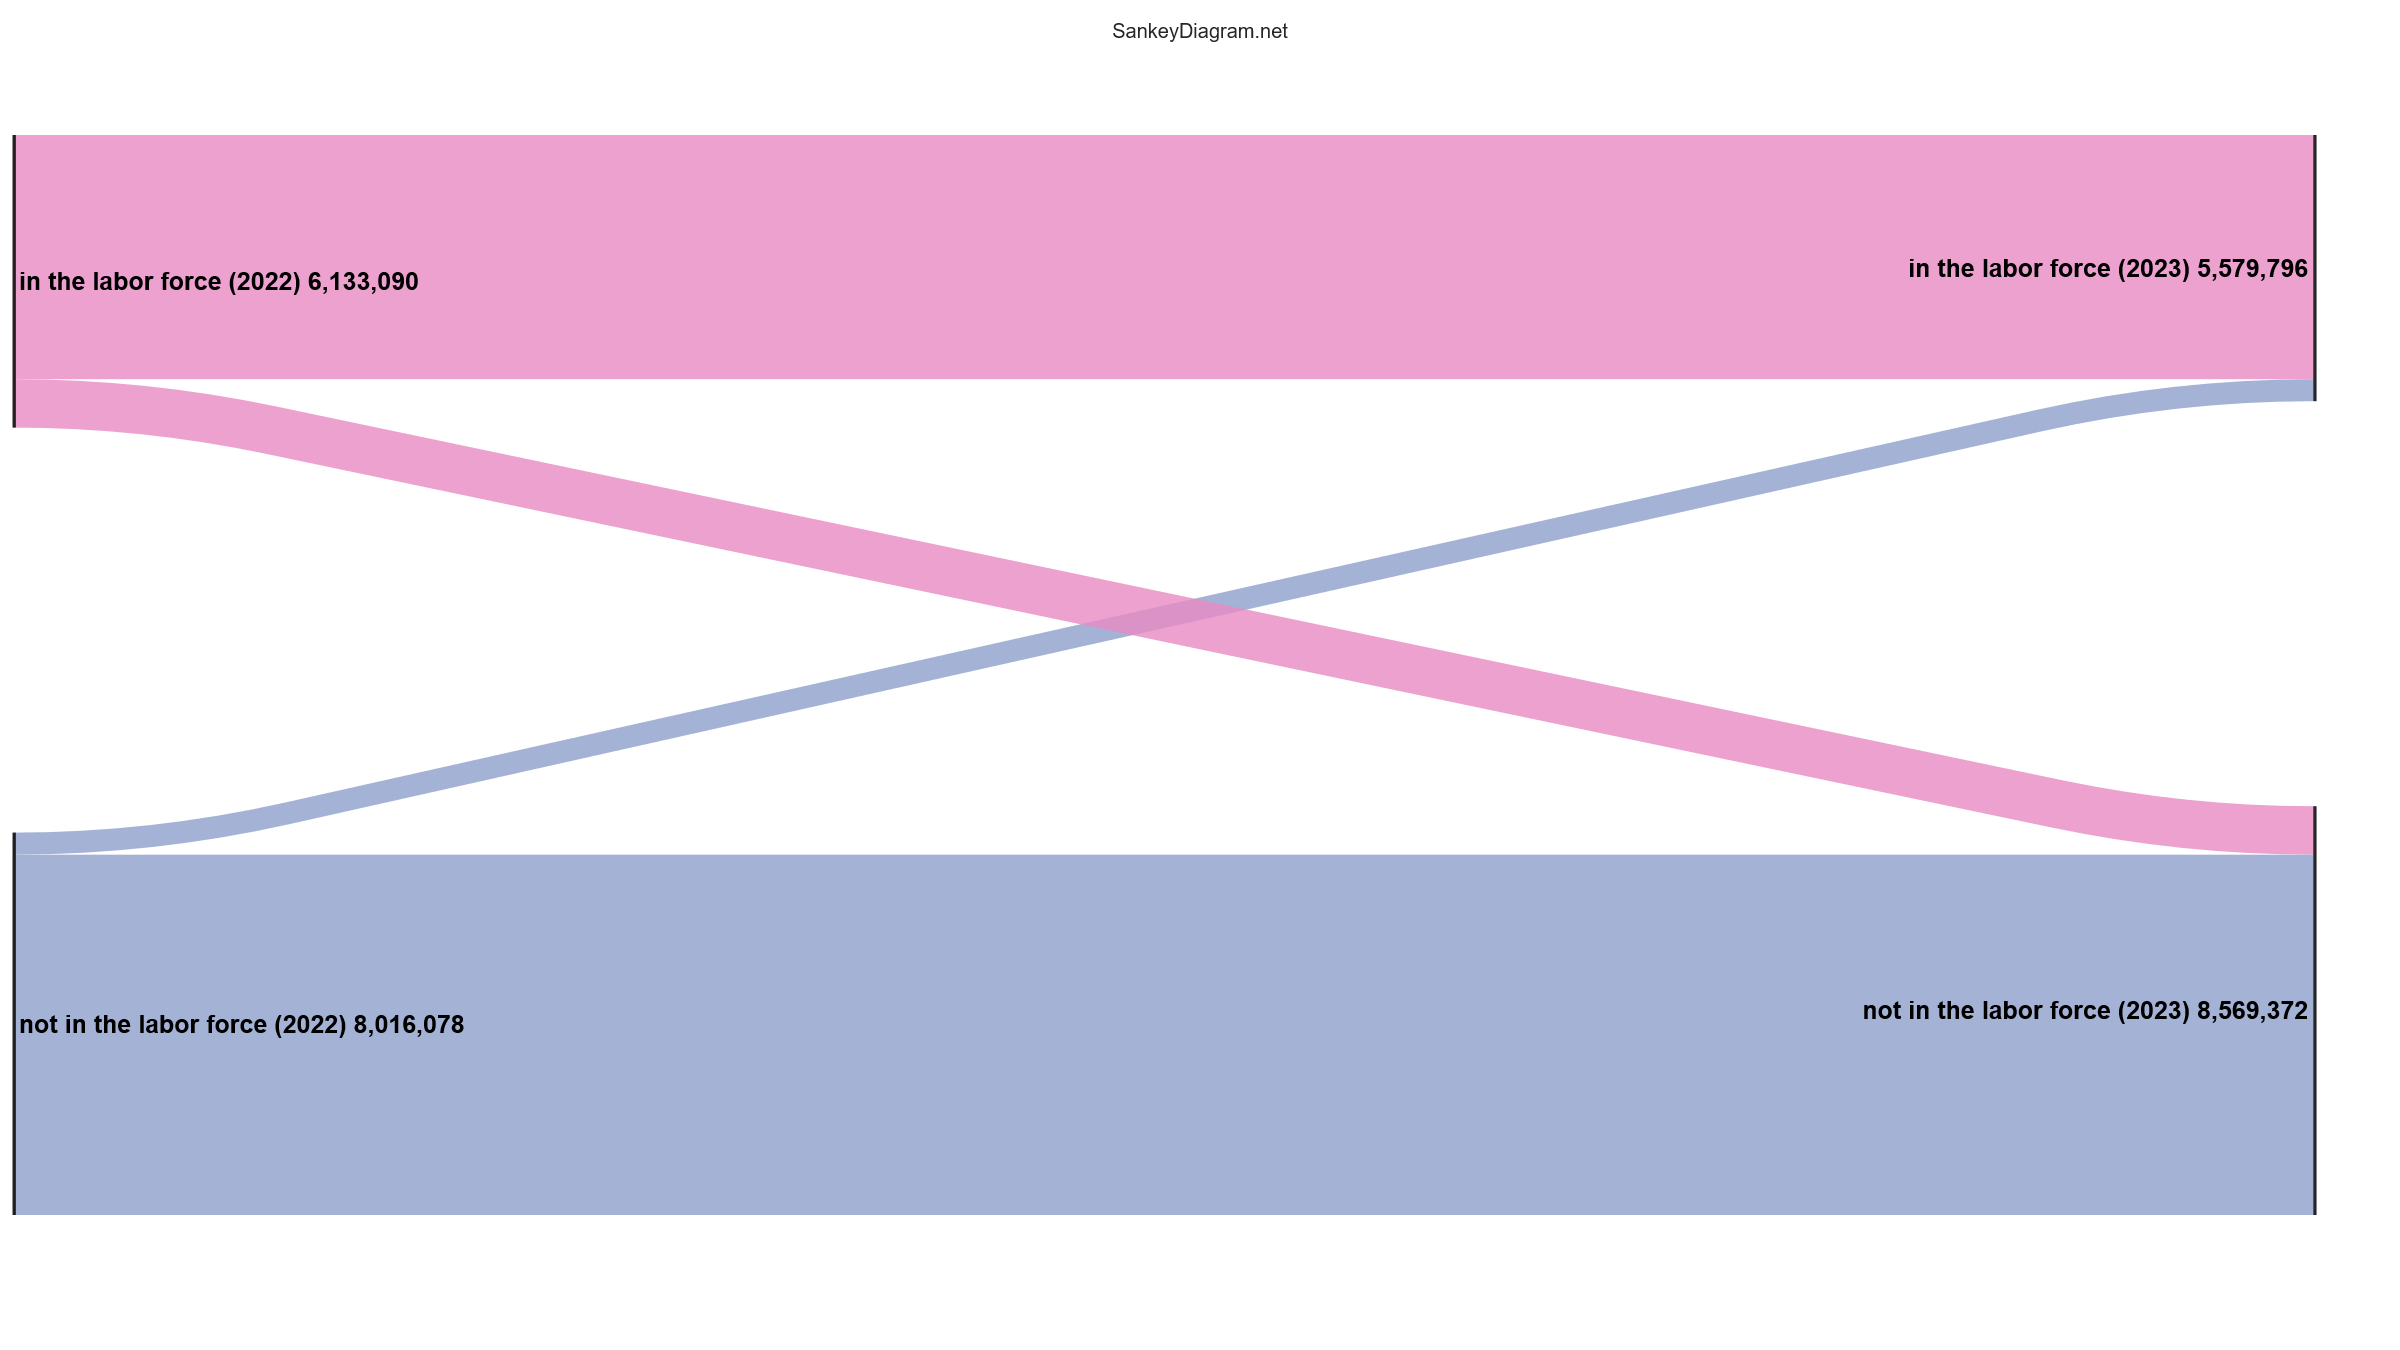
As you can see, the bulk of them kept the same labor force status between the two surveys, but a few did crossover to the other group. The labor force participation rate dropped slightly, probably driven by retirements as the sample aged.
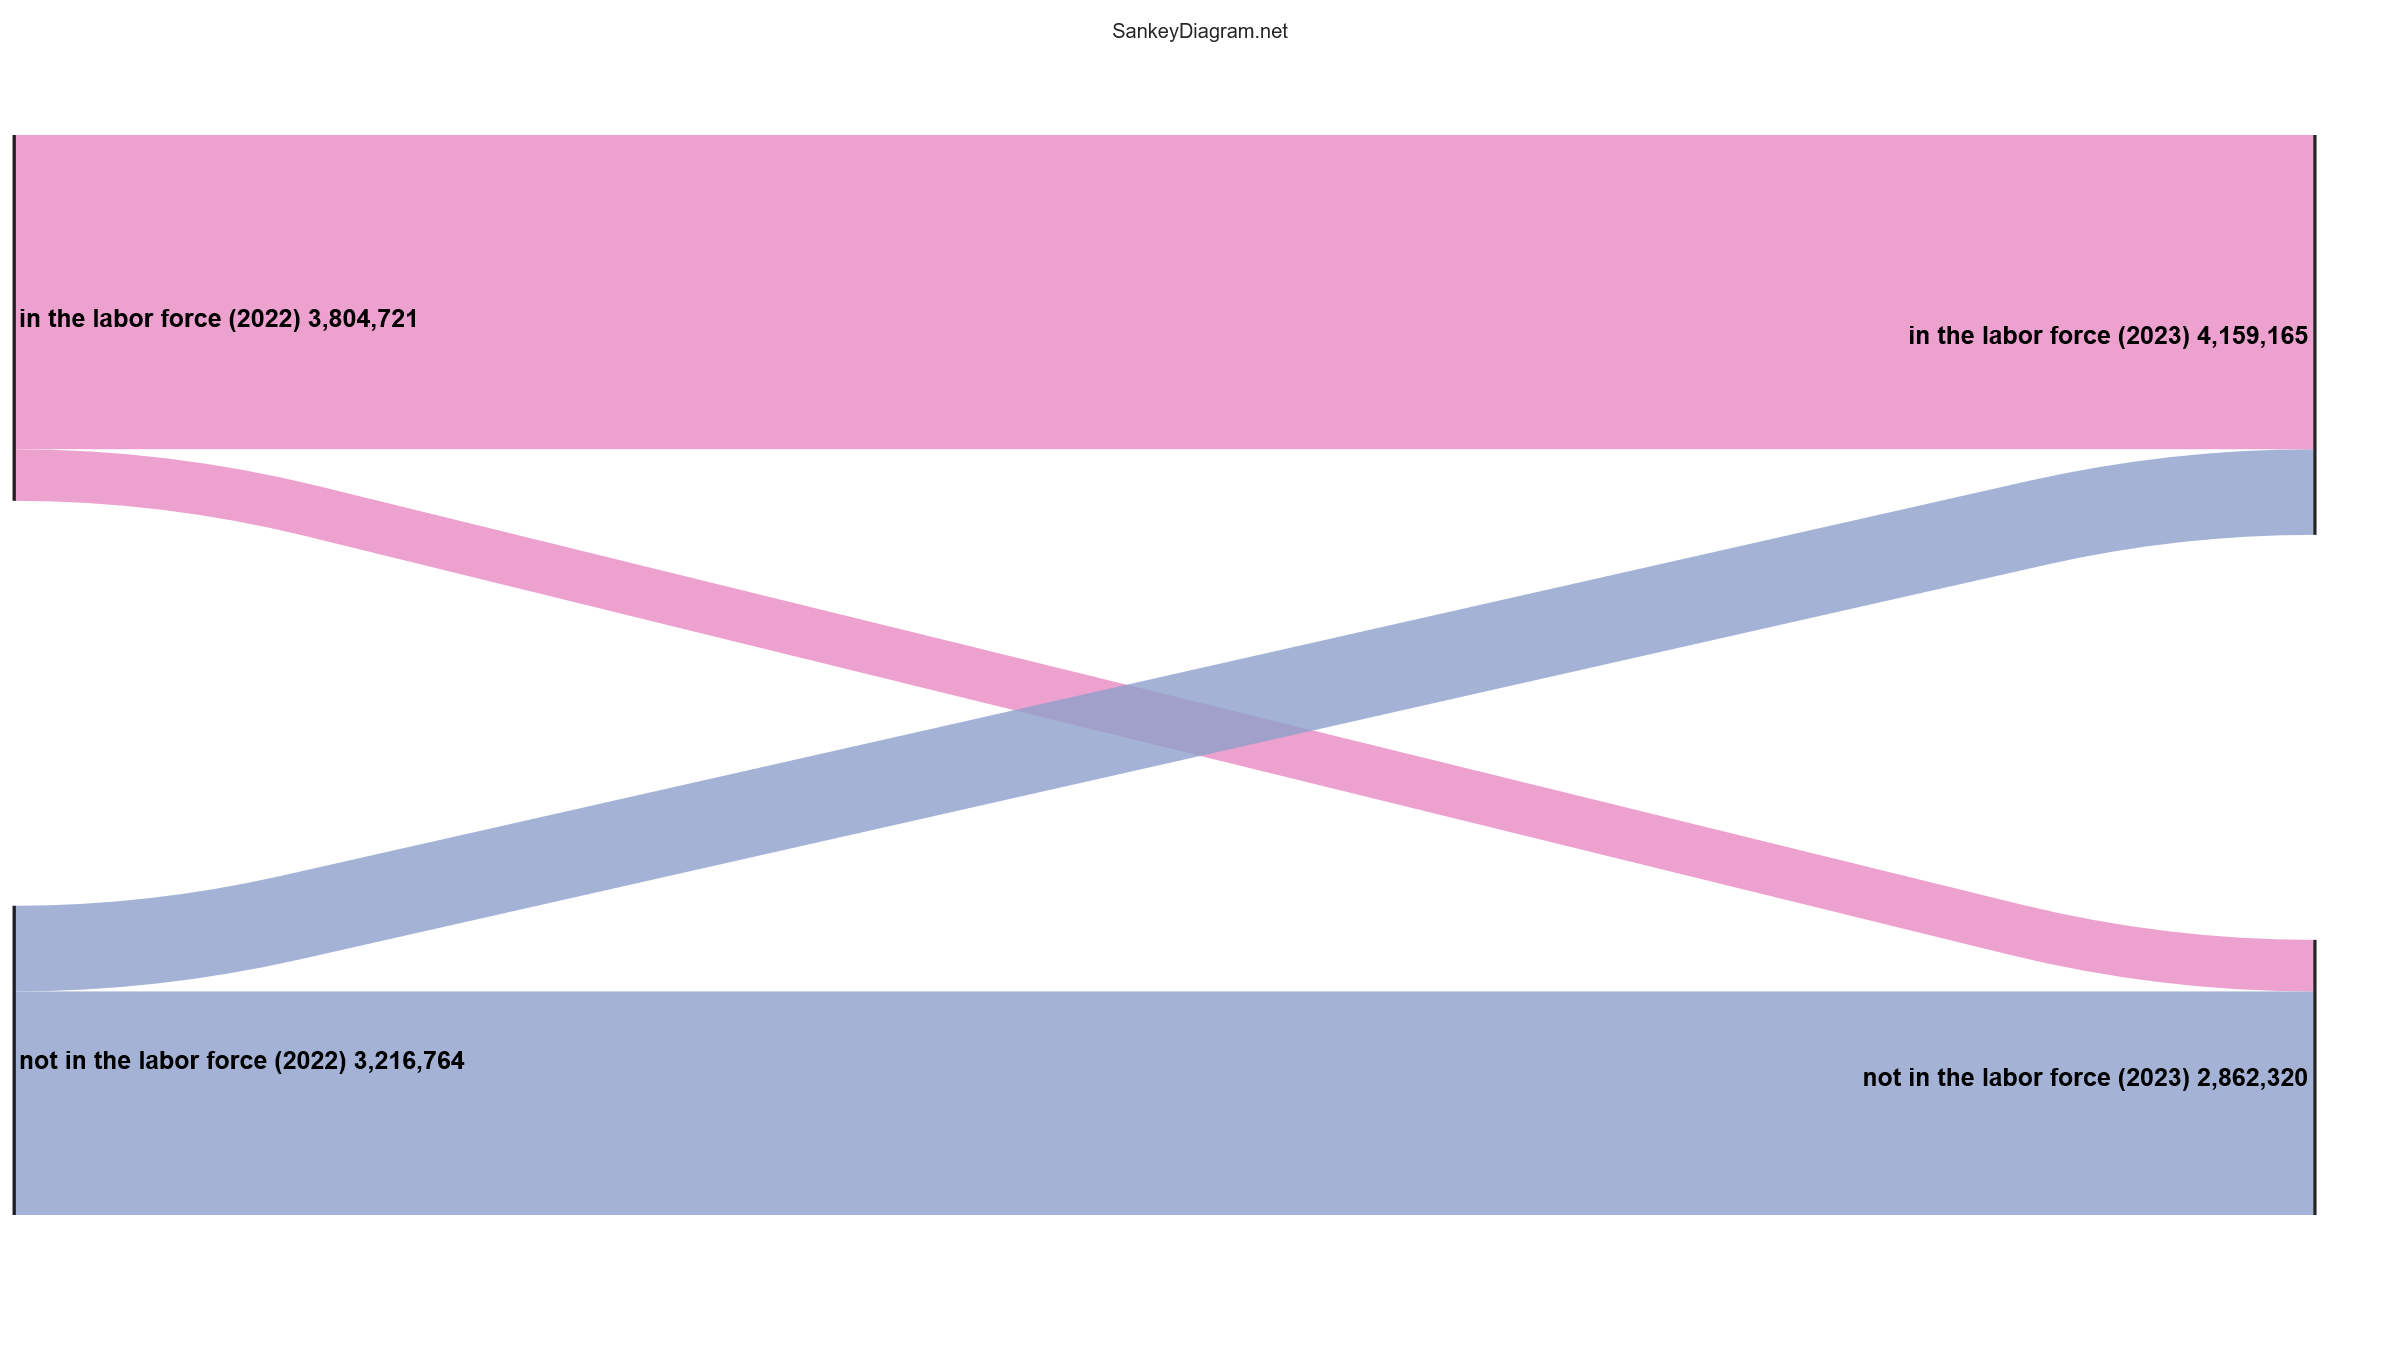
Here’s the same time frame, but for respondents who were 16-24 in 2022. Labor force participation rose, likely the result of more of the sample finishing high school or college between 2022 and 2023.
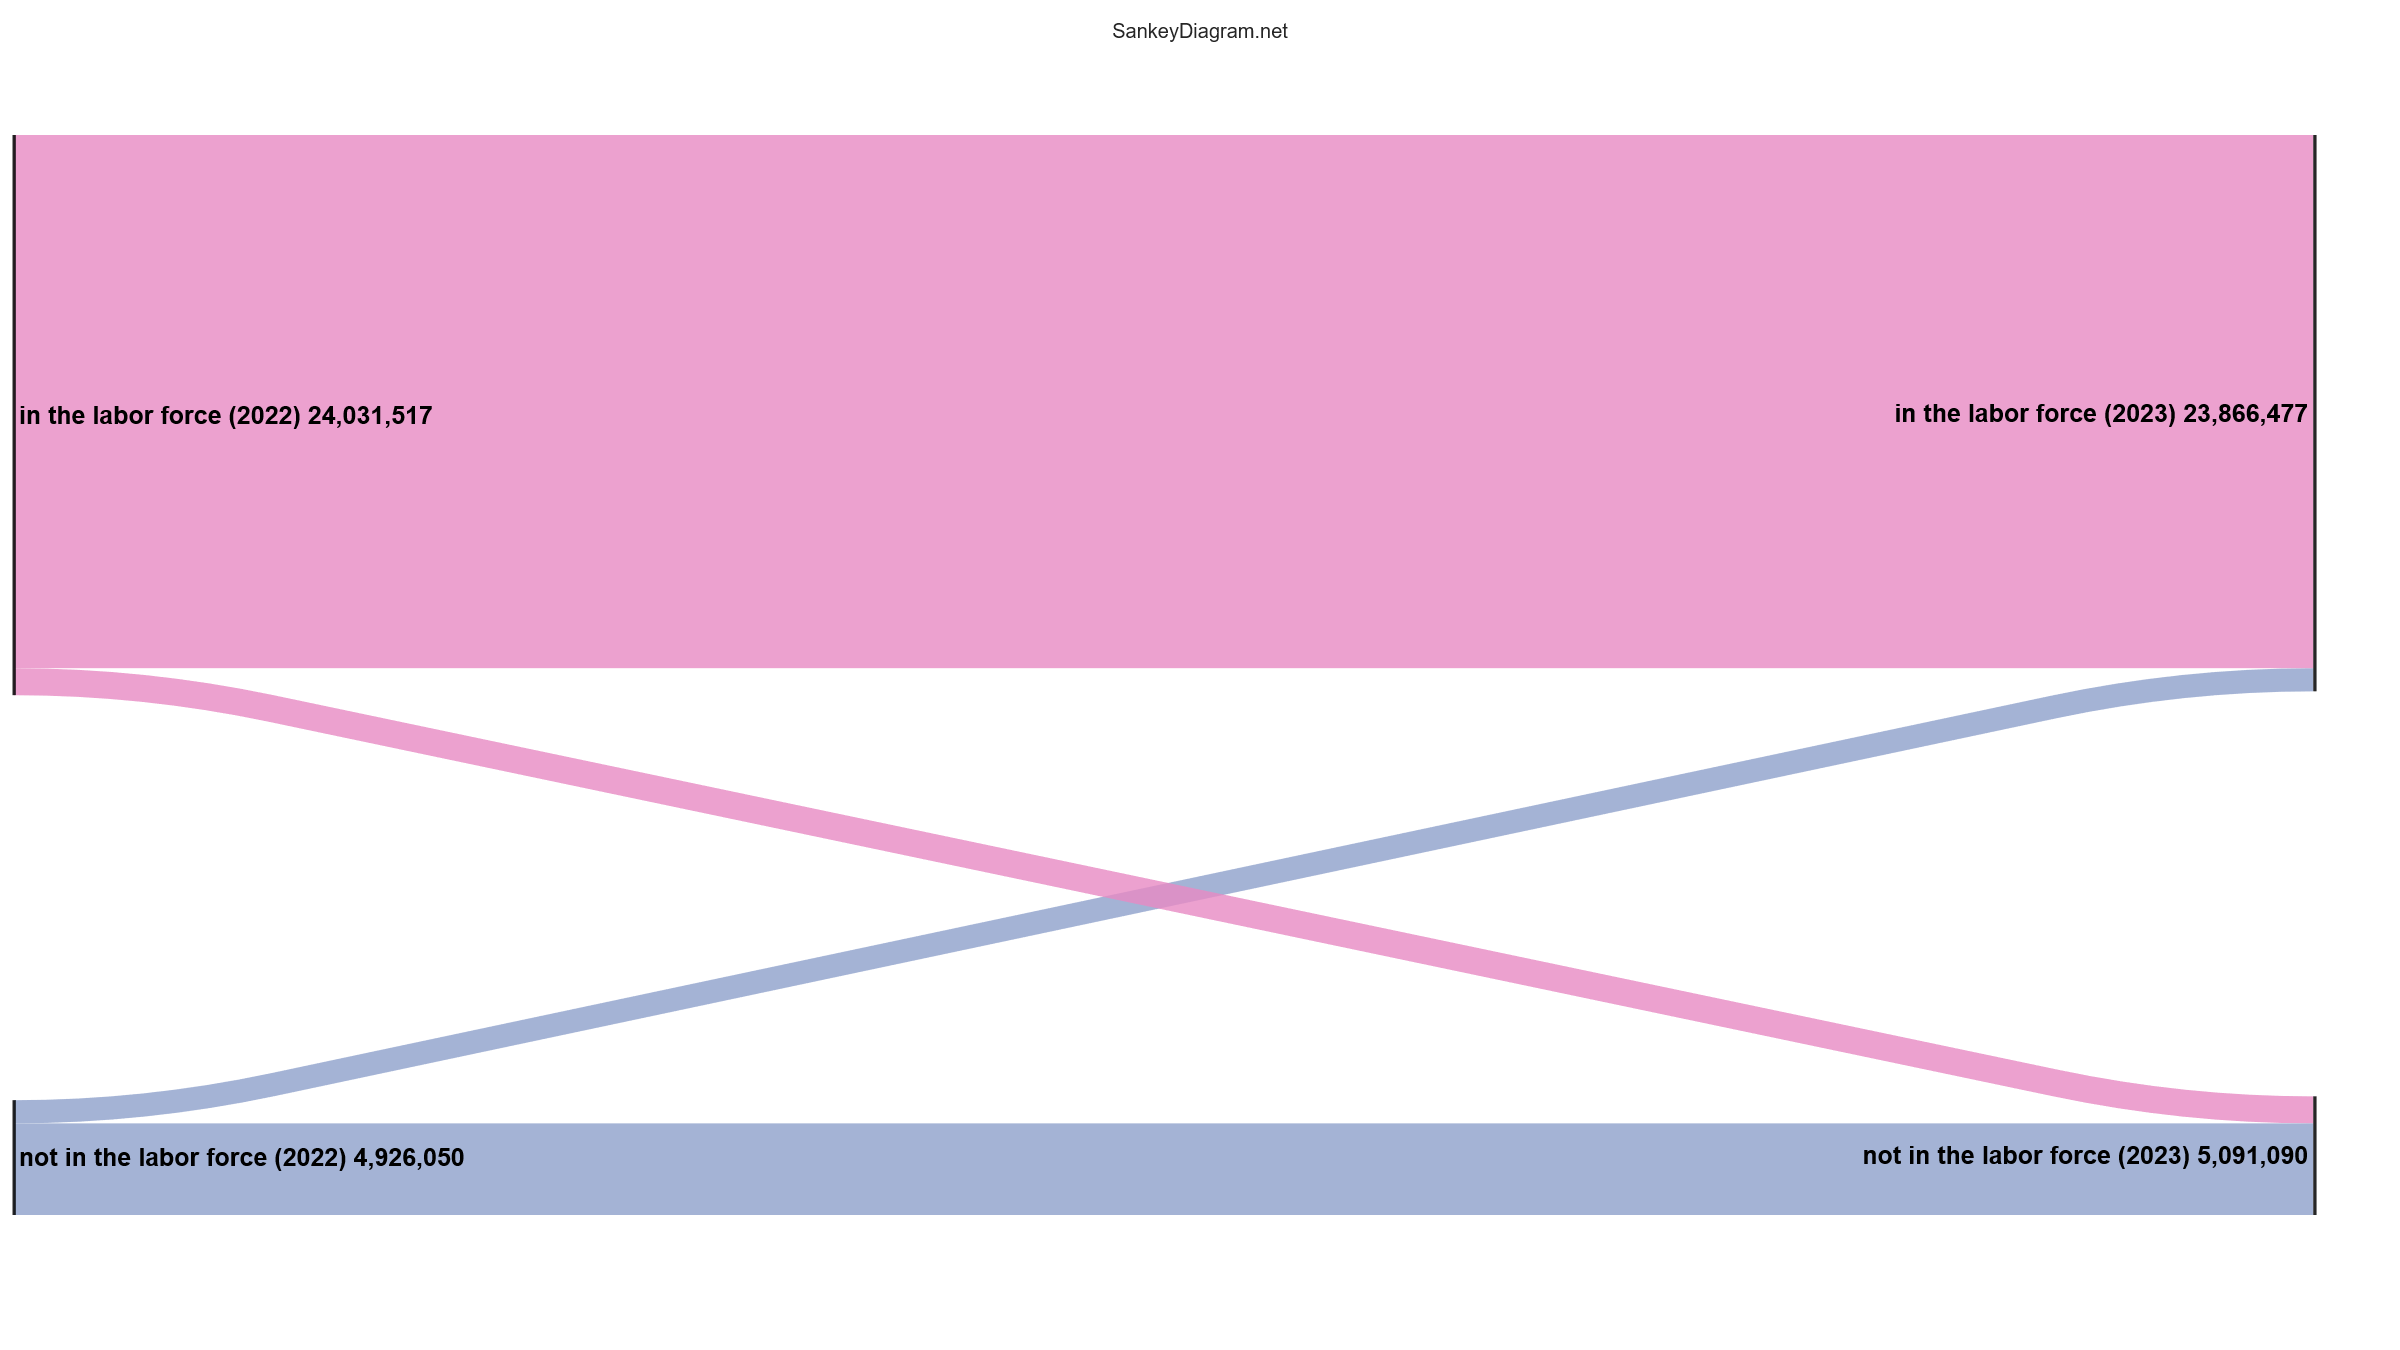
For prime working age respondents (below, 25-54 in 2022), the labor force participation rate is much higher than either of the two previous samples, but the churn still exists. Out of the entire prime working age population, 7.4% switched groups between 2022 and 2023, but for women 8.6% switched while for men it was 6.2%.
Mothers
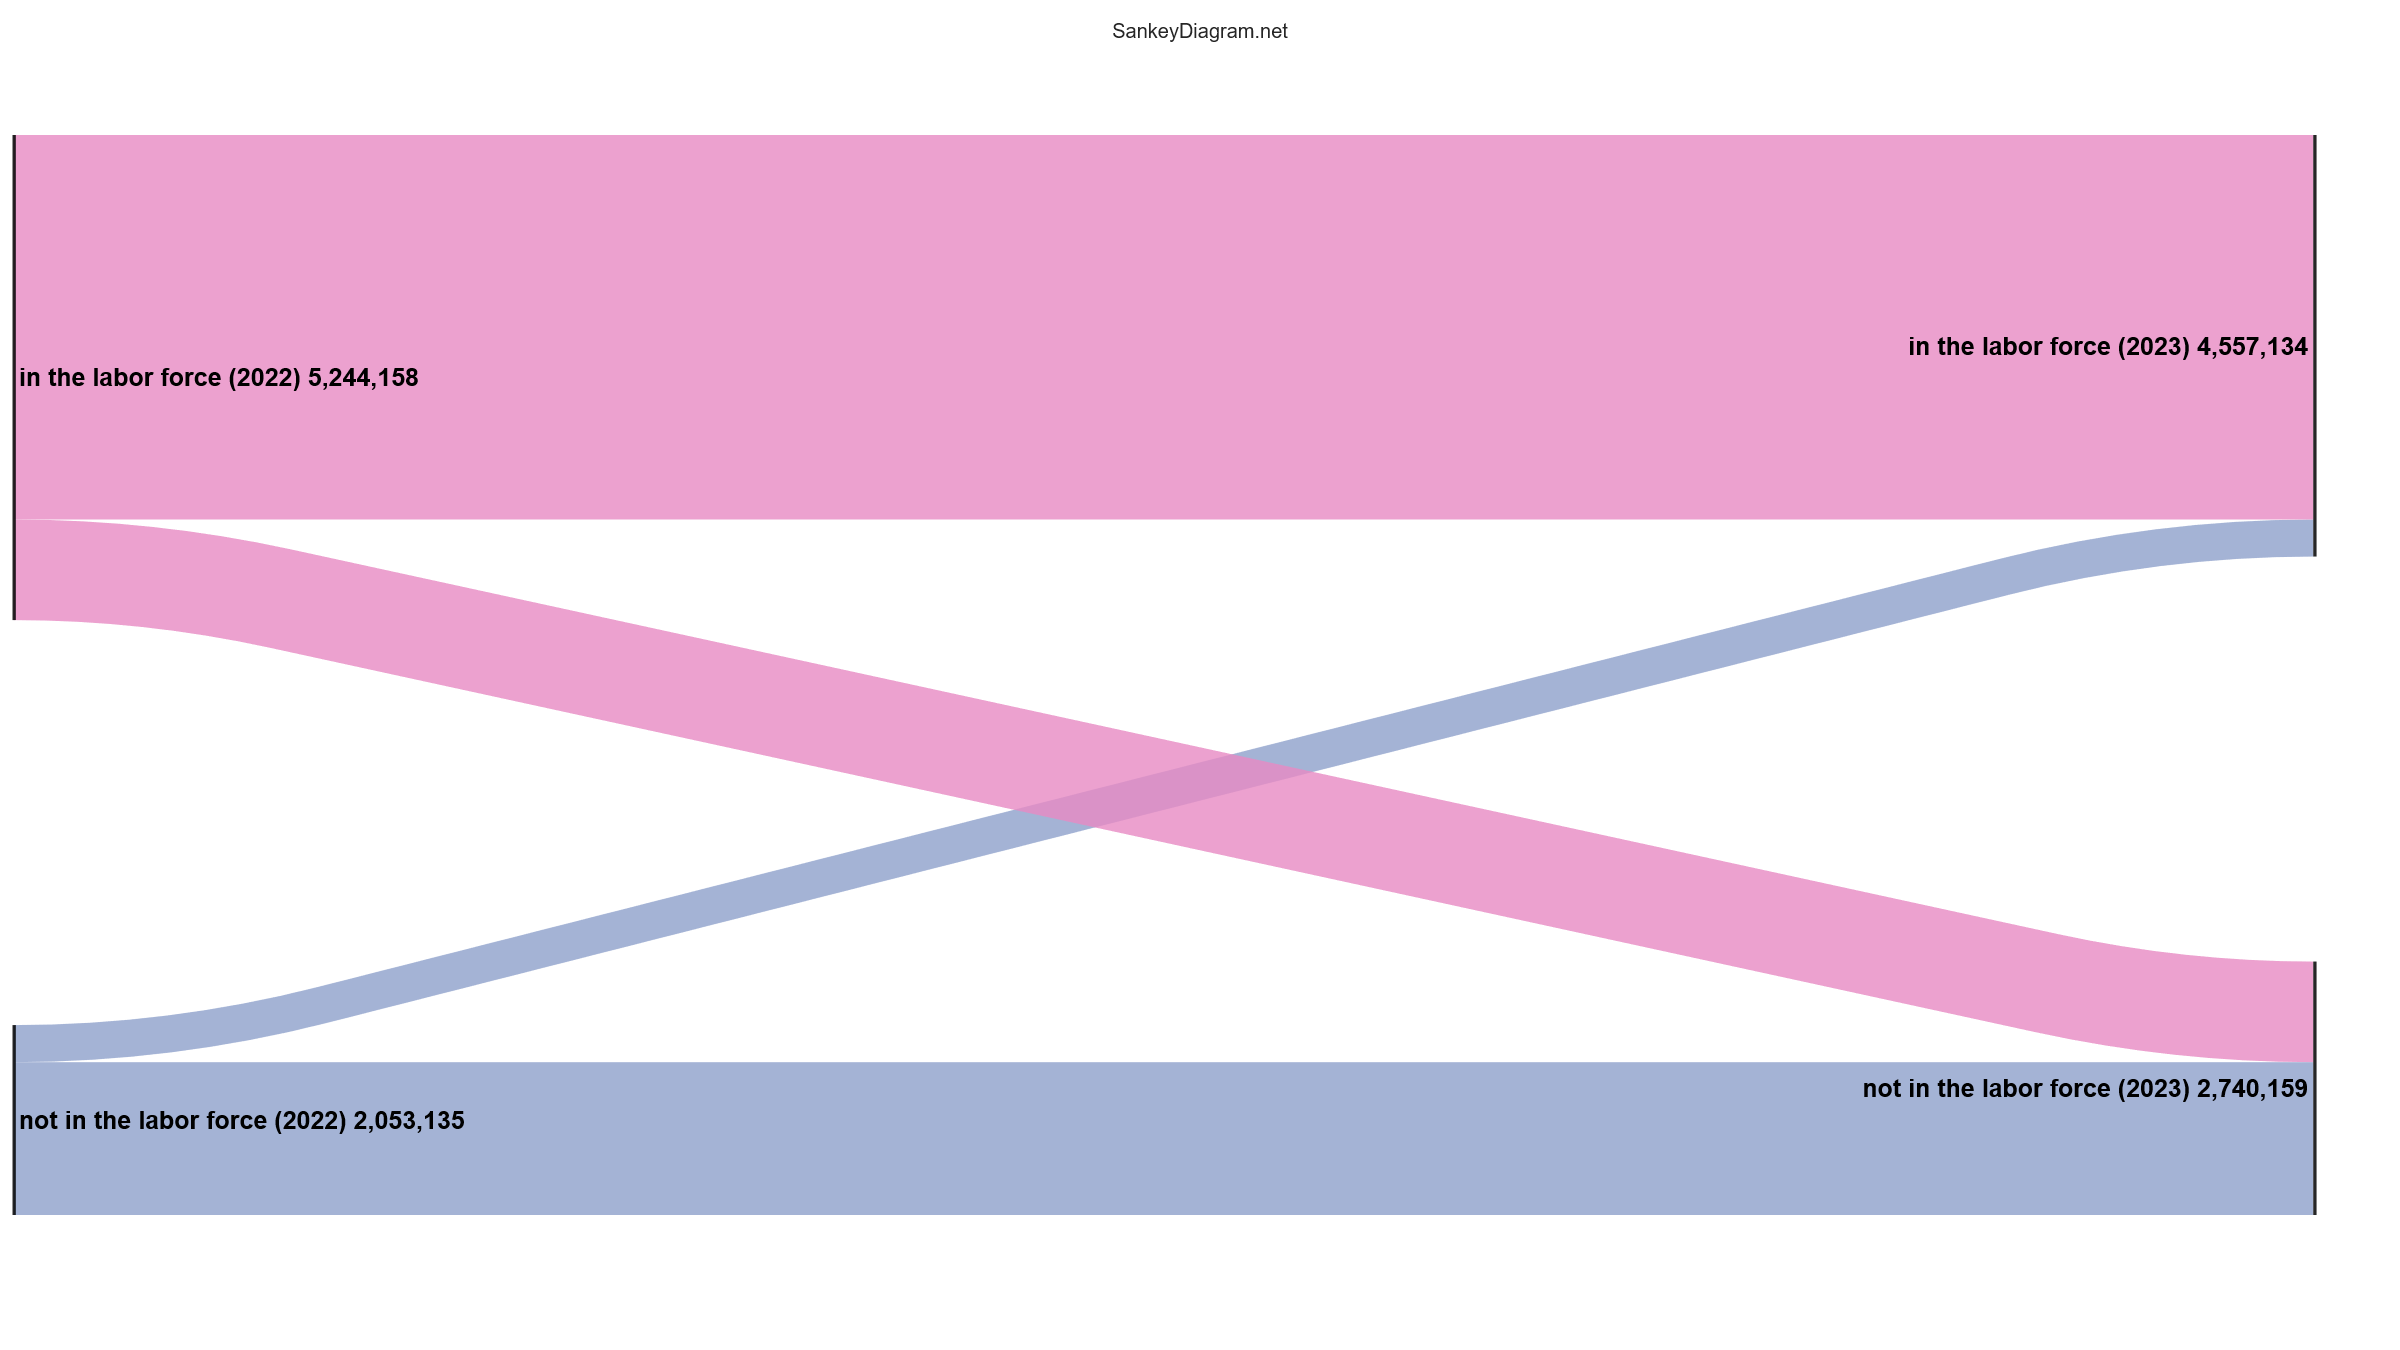
The group I’m most interested in though is women who report that their youngest child is below the age of 1 in the second year of the survey — women who can reasonably be assumed to have had a birth in between their first response and their second response. What did these women do?
First, 20.4% switched their labor force status between year 1 of the survey and year 2.1 They had a labor force participation rate of 71.8% in year 1 responses, and 62.4% in year 2 responses. You can see from the diagram below that more moved out of the labor force than re-entered, but re-enterers did exist.
In every educational grouping, mothers of infants were more likely to have left the labor force than mothers whose youngest child in year 2 was at least 1 or women between 18 and 45 who did not have a child under 18, but the churn varied by educational grouping. For example, 21% of mothers of infants with a high school diploma moved out of the labor force between year 1 and year 2, compared to 12.5% for those mothers with bachelor’s degrees and 7% with graduate degrees. While for mothers without infants, 7% of those with high school diplomas, 4.2% of those with bachelor’s degrees, and 2.5% of those with graduate degrees churned out of the labor force.2 Year 2 labor force participation rate for both mothers of infants and mothers of non-infants was higher for mothers with more education, lining up with some Pew data from 2012-2014.
Personal earnings were also linked to labor force participation. Mothers of infants who remained in the labor force reported $61,080 for year 1 earnings (2023 dollars), compared to $32,743 for those mothers who moved out of the labor force between year 1 and year 2 (p<0.0001).
A similar dynamic plays out for returning to the labor force. Among mothers who had an infant in year 1 and were out of the labor force, 33% of those with graduate degrees had returned to the labor force in year 2 of the survey, compared to 27% of those with high school diplomas.
But the Current Population Survey only tracks longitudinal participants for two survey waves. A respondent who is out of the labor force in year 1 and year 2 may very well re-enter the labor force in year 3 or year 7, but that information isn’t collected. To try and find longer-term data, I turned to the Panel Study of Income Dynamics.3
From 1979 to 2021, I was able to pull the employment answers of 5767 mothers whose oldest child was born in or after 1979 and whose youngest child reached 18 by 2021. 89% of them had at least one response year during their children’s childhood of being in the labor force, and 64% had at least one response year of not being in the labor force. PSID also asks a more detailed question about employment status, allowing me to pull out employed mothers (as distinct from unemployed mothers who were looking for work — defined as still being in the labor force) and homemaker mothers (a difference response code than retired, permanently disabled, or student). 83% of mothers were employed during a survey year before their youngest child turned 18, and 56% responded that they were a homemaker at least once.
Much like the CPS data, this is stratified by education. 51.4% of mothers with a bachelor’s degree reported being a homemaker, whereas it was 58.1% of mothers with a high school diploma and 46% of mothers with at least some post-undergraduate education. 81.6% of mothers with a high school diploma reported being employed during at least one survey year before their youngest child turned 18, compared to 92% of mothers with a bachelor’s degree and 96.9% of mothers with graduate work.
It also varied by the number of children a woman had. 39.4% of women with 1 child had at least one response of homemaking, compared to 57.1% of women with 2 children and 69.1% of women with 3 children.4 Employment varied much less — 79.9% of women with 1 child reported being employed during at least one survey, compared to 85.8% of women with 2 children and 82.56% of women with 3 children. In short, being out of the labor force (and identifying as a homemaker) at least once doesn’t strongly reduce the chance of having had at least one spell of employment while children are under 18. It’s unusual for mothers (though not unheard of, and more common in lower education groups) to never report employment.
57.8% of ever-married mothers reported at least one instance of homemaking, compared to 49.1% of never-married mothers. But married mothers were also more likely to report employment — 86.4% were employed for at least one survey response, compared to 68.9% of never-married mothers.
What about fathers?
Fathers, generally speaking, have less labor market churn. Only 3.1% of fathers reported a period of homemaking during their children’s childhood, though 14.6% spent time out of the labor force. Only 5.3% of fathers never reported employment. There are some signs of educational stratification — 3.9% of fathers without a high school diploma never reported being in the labor force, compared to 1.6% of those with a high school diploma, 0.4% of those with 4 years of college, and 0% of those with graduate work.
To get a larger sample, I’m now looking at longtiduinal respondents between 2010 and 2023. The survey tracks them between e.g. 2010 and 2011, but not between 2010 and 2014.
You can see the whole table here. It’s longer than usual, which is why it’s relegated to a footnote.
Panel Study of Income Dynamics, public use dataset. Produced and distributed by the Survey Research Center, Institute for Social Research, University of Michigan, Ann Arbor, MI (2024). The collection of data used was partly supported by the National Institutes of Health under grant number R01 HD069609 and R01 AG040213, and the National Science Foundation under award numbers SES 1157698 and 1623684.
74.5% for mothers of 4, 84.7% for mothers of 5, and 84.3% for mothers of 6, but these women collectively made up less than 10% of the sample