


Employed without Child Care

According to the National Household Education Survey — Early Childhood Program Participation numbers, 22% of young children with both parents employed full-time had no regular non-parental child care arrangement in 2023, up from 14% in 2019. The Department of Education hasn’t released the 2023 data file yet, and while the 2019 data file has lots of information, it doesn’t have continuous income data or much information about parental schedules. I was curious how these parents differed from employed parents with child care.
Are 67% of parents spending more than a fifth of their income on child care?

In August, CNBC published a story headlined “Majority of parents spend 20% or more of household income on child care, report finds” and linked to a Care.com report of 3000 parents.
I turned, once again, to the Panel Study of Income Dynamics. Unfortunately, PSID doesn’t collect shift information, such as whether one parent is working nights or weekends, though it does collect commute information.
In 2014 and 2019, two years where the PSID collected detailed child care information through the Child Development Supplement, the survey collected data on 2133 children not yet enrolled in kindergarten. 56% of these children had a non-parental care arrangement, roughly in line with NHES-ECPP data.
For preschool children with both parents in the labor force (n=799), 65% had a child care arrangement — less than NHES:ECPP. The chance of having a care arrangement went up with maternal earnings (p<0.001).
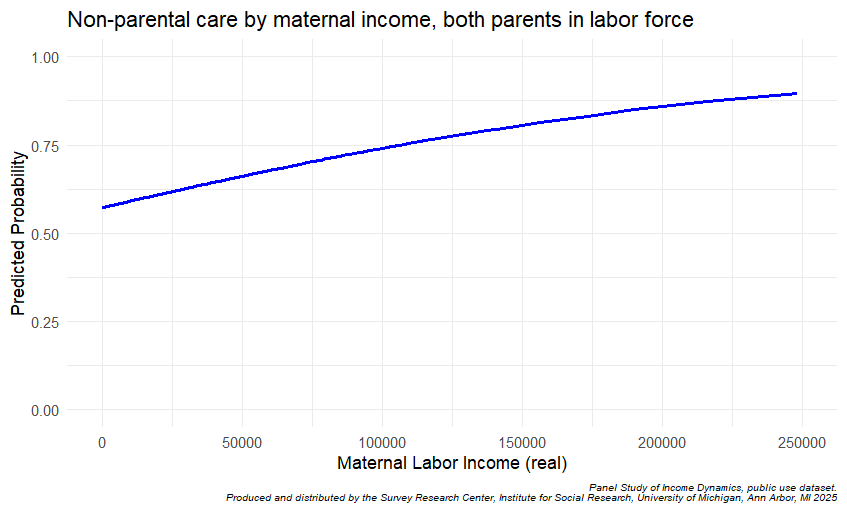
However, this association didn’t remain significant when I controlled for annual work hours by calculating the average hourly wage, suggesting that lower participation among lower-earning moms may be driven more by part-time employment than by earning power. Or alternatively, moms with less earning power may be more likely to choose job schedules that wouldn’t require finding and paying for child care. Child care participation did increase significantly with maternal employment hours.

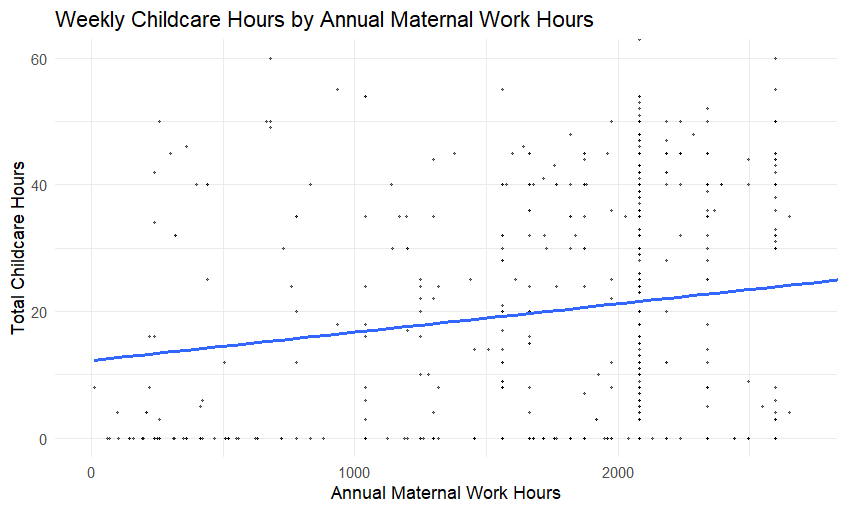
Total non-parental care hours also increased with maternal work hours. However, as you can see from the bottom of the graph, many families reported no child care arrangements across a wide range of maternal work hours.
Once I dropped out children without a non-parental care arrangement, there was no significant relationship between annual maternal work hours and child care hours.
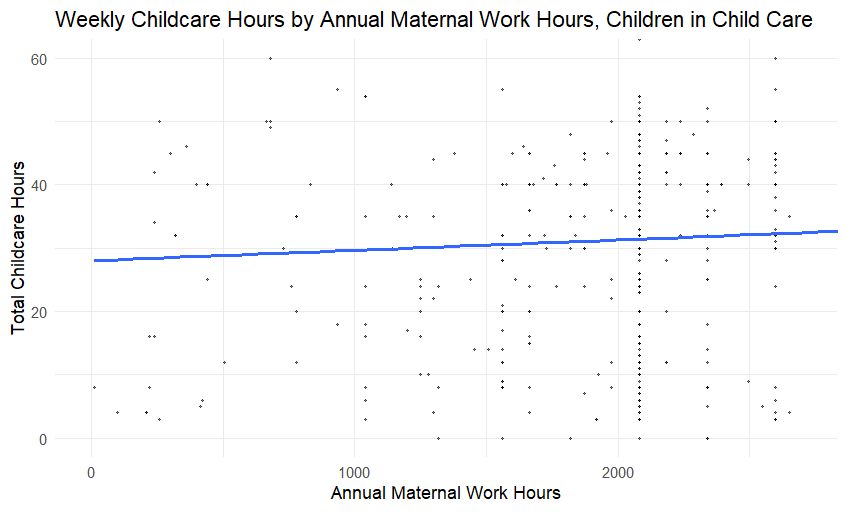
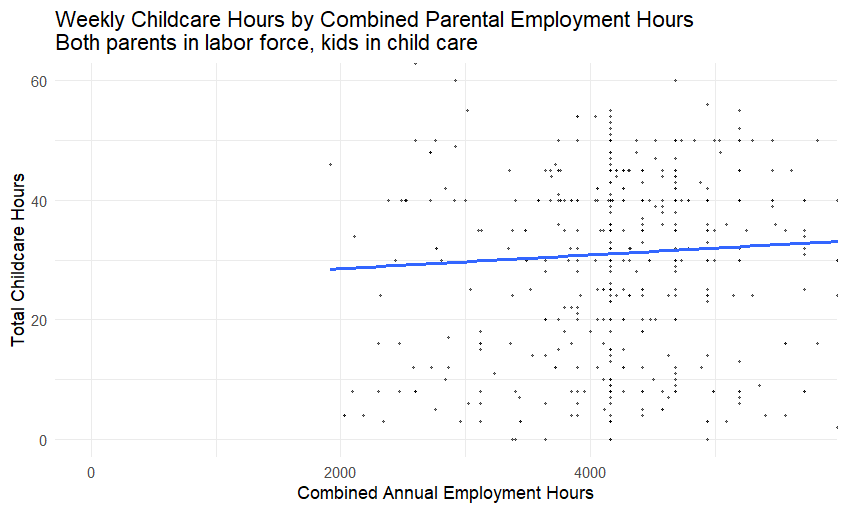
Child care hours increased significantly as total parental employment increased.
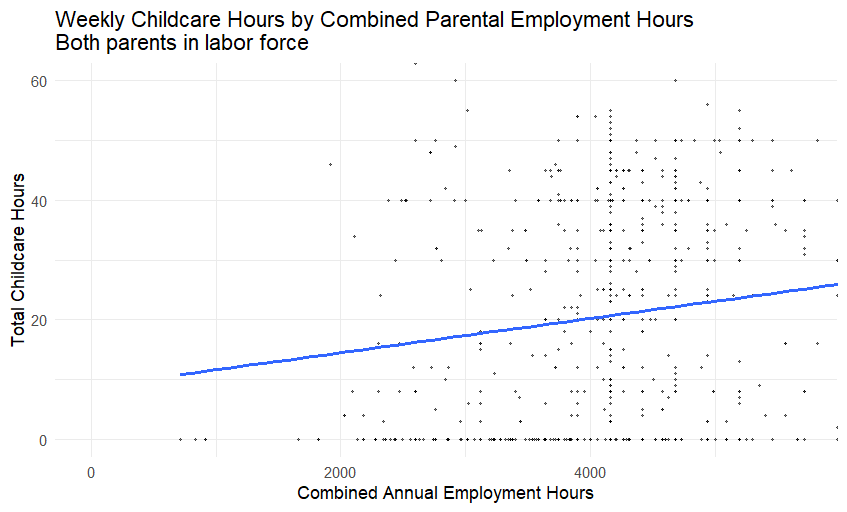
But again, it lost significance once I dropped out the kids without a child care arrangement. Once both parents are employed and a child is in child care, weekly hours seem to hover around 30.
72% of kids with both parents employed full-time had child care, while it was 57% for kids with dad employed full-time and mom employed less than full-time and 58% for kids with an “other” arrangement — which could include mom employed full-time and dad employed part-time or both parents employed part-time. This was the smallest group — 38% of preschoolers had at least one parent out of the labor force (usually mom), 36% had both parents employed full-time, 18% had dad employed full-time and mom employed part-time, and 8% fell into the “other” category.
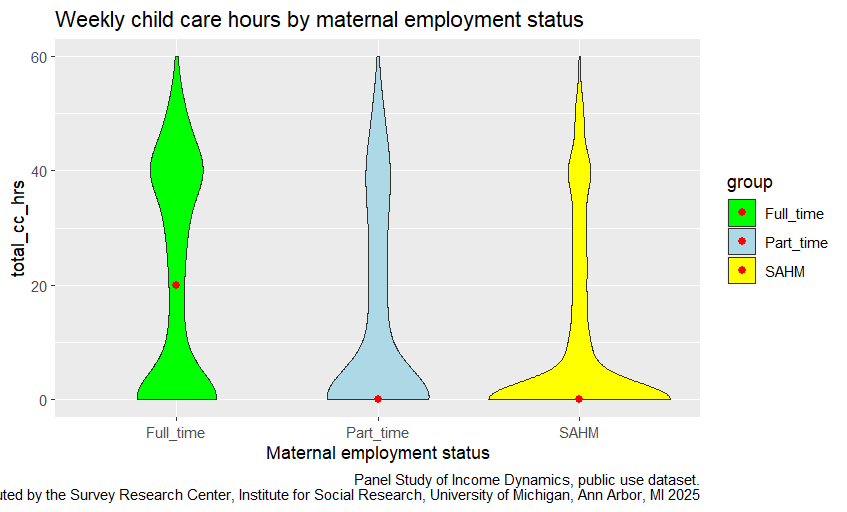
The red dot in the graph above represents the median number of child care hours for preschoolers. There’s a bulge around 40 hours of child care for moms employed full time. While many families appear to have fewer child care hours than employment hours, there’s still a fair number that are closely matching child care to employment.
As for who is employed without child care, a few variables pop out as significant. Moms without college degrees were more likely to be employed without childcare — 41% versus 31%. Moms who worked from home were also more likely not to have childcare — 53% versus 36%.1 Finally, currently-married couples were actually less likely to be employed without childcare than unmarried parents — for married employed parents, 35% didn’t report a childcare arrangement, whereas it was 40% for unmarried parents.
All of this data was from prior to the pandemic — it will be interesting to see how childcare program participation as reported in the PSID changes for 2021, 2023, and 2025.
Childcare program participation drops

The first look report at the 2023 Early Childhood Program Participation survey came out this week! I have been checking for it about once a week since August, and I’m so glad it’s finally here, even if I’m still waiting for the full data files.
Though between the two years, only 72 moms reported that they didn’t commute because they worked from home.
"currently-married couples were actually less likely to be employed without childcare than unmarried parents — for married employed parents, 35% didn’t report a childcare arrangement, whereas it was 40% for unmarried parents." Maybe a silly question, but could this be related to SES or is that already being taken into account?