


Other Numbers on Child Care
$18,000, dependent care FSAs, and graphs

So most parents aren’t paying anything at all for child care and the ones who are aren’t usually paying a fifth of their income. What about some of the other claims in the report?
Are 59% of parents spending more than $18,000 per child?
No. Again, NHES:ECPP and CPS-ASEC have the data here. $18,000 in 2023 is $14,950 in 2019, or $287.50 a week. According to ECPP data, 17% of parents using center or nanny care or 7% of all parents would have paid that much per child. 2022 CPS-ASEC puts that same number at 15% of families reporting any costs and 5% of all families with a child under 5 (family-level cost rather than child-level).
The report also claims that 45% of families making less than $100,000/year, 43% of families making less than $75,000/year, and 39% of families making less than $50,000 per year will spend more than $18,000. This is also false. I’m not really sure how a claim that over a third of families making less than $50,000 would be spending at least 36% of their income on child care made it past basic editorial review.
Are almost half of parents relying on relatives for care?
Pretty much! Among children with at least one regular child care arrangement, 38% are cared for by relatives (22% overall).1 38% is close enough to 42% that I think it’s reasonable to say they actually got that claim right. Good job!
Taxes
Are there tax benefits available for child care? Yes, with caveats.2
First is the Child and Dependent Care Tax Credit (CDCTC). The CDCTC is a non-refundable tax credit, meaning you have to have pre-credit income tax owed in order to benefit from the credit. The maximum percentage of the credit is 35% of up to $3,000 of expenses for one qualifying child or $6,000 for two or more children, and it’s available to tax filers with adjusted gross income’s less than $15,000/year.
Or rather, “available.” Here’s a helpful chart from the Congressional Research Service.
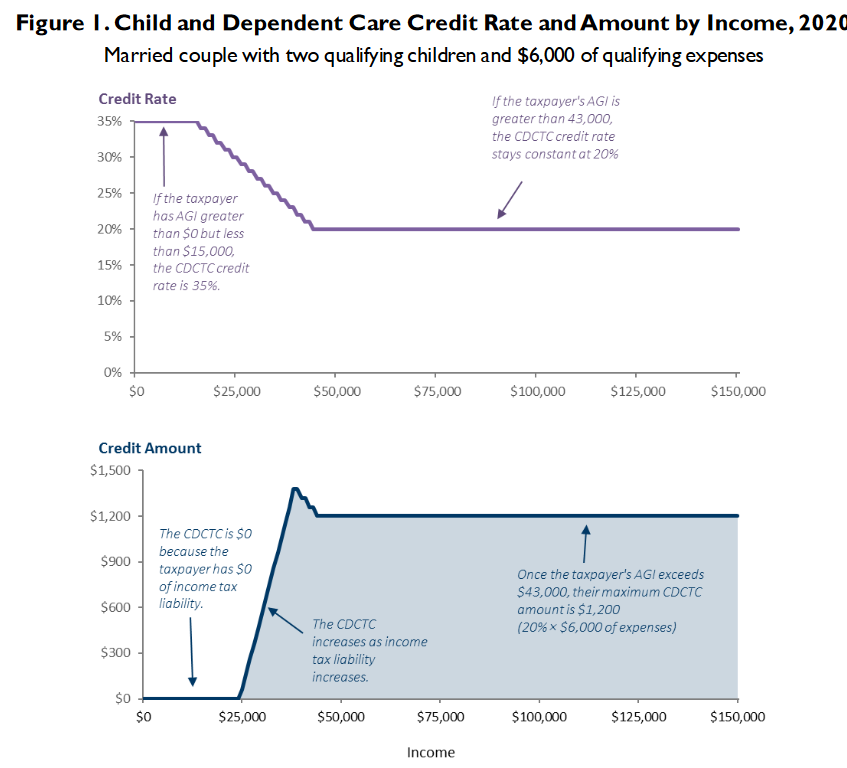
Because the credit is non-refundable, anyone making less than the standard deduction — and therefore having a federal income tax liability of $0.00 — cannot receive any benefit from the CDCTC. According to CRS, while taxpayers with AGIs under $15,000 made up 21.2% of all returns in 2018, they received only 0.1% of CDCTC benefits, while taxpayers with AGIs above $100,000 filed 19.4% of returns and received 44.2% of the benefits.
The second benefit is a Dependent Care Flexible Spending Account (DCFSA). These accounts allow employees to contribute pre-tax dollars (exempt from payroll and income taxes) to an account that can only be spent on child care. The savings percentage depends on an employee’s marginal tax rate. A married couple both making first decile wages would earn a combined $61,048 in 2023.3 Assuming they could afford to contribute the maximum $5,000 to a DCFSA, they would save $982.50 on payroll and federal income taxes, or almost 20%. A married couple making ninth decile wages would earn $289,224 and save $1,582.50 (31.65%) on a $5,000 contribution. Not all employers off DCFSAs — that same CRS report estimates that 13% of first decile wage earners have access to a DCFSA, compared to 68% of ninth decile wage earners.4
A note on methodology, or how they maybe got it so wrong
Care.com’s numbers, in short, are very off from the more reliable federal data. Even after taking into account that they restricted their sample to paid “professional child care,” the gross and percentage amounts of child care are quite a bit higher than federal estimates. And their numbers were widely circulated — a major DC think tank, Center for American Progress, tweeted out the related CNBC article twice.


So why is it wrong? Since the underlying data wasn’t released, it’s hard to know for sure, but I think a clue lies in this sentence: “Parents now rely equally on daycare centers and nannies (each 30%) as parents’ top child care arrangements.”
Nanny care is unusual. Only 1.6% of children are regularly cared for by a paid non-relative in the child’s own home. Nannies, however, are very expensive. Based on ECPP data, the median hourly rate for a nanny in 2019 was $15 an hour — lower than the nationwide full-time hourly wage of $23.40,5 but still much higher than the median hourly rate for center care of $5.88. A oversample of nanny care, combined with the exclusion of relative care and free center-based care like Head Start or public prekindergarten, could go a long way towards inflating care costs.
Paid child care is expensive, which is probably why most young children aren’t in paid child care. The families spending more than $18,000 per year are disproportionately likely to have at least one parent with a graduate degree and/or a top quintile income.
Table 1, Cui, J., and Natzke, L. (2021). Early Childhood Program Participation: 2019 (NCES 2020-075REV), National Center for Education Statistics, Institute of Education Sciences, U.S. Department of Education. Washington, DC. Retrieved 11/11/2023 from http://nces.ed.gov/pubsearch/pubsinfo.asp?pubid=2020075REV.
This is not tax advice.
Table 6
Thanks for this. I found this part very curious as well: "The report further reveals a concerning correlation between caregiving and overall well-being, leaving 90% of parents losing sleep, 80% crying (increasing to 90% for moms specifically), 75% feeling a sense of dread, 71% experiencing health issues, and 29% even considering suicide or self-harm due to the challenges of finding, managing, and affording care."
I dug into parental well-being studies for my book and nothing came close to being this bleak.
Overall the methodology just seemed hmmmm in this Care.com report.
"The report finds that the average parent who responded is responsible for five loved ones, resulting in the management of five different care arrangements, yet nearly half (48%) say that they still don’t have enough help." Pets are included here...
Over the years I have been pitched many studies from profit-making companies like Care.com that have a financial interest in a certain outcome...I've grown increasingly skeptical. And it is a shame because we need good data on care, and parents/caregivers have needs that aren't being met. But this doesn't get us closer to clarity.
You know the funny thing about the FSA is that it SHOULD be close to $18k. It was created in 1986 and set at $5k. Adjusting just for CPI inflation puts you at $14k. If we used childcare and health inflation, it’d probably be approaching $30k.